
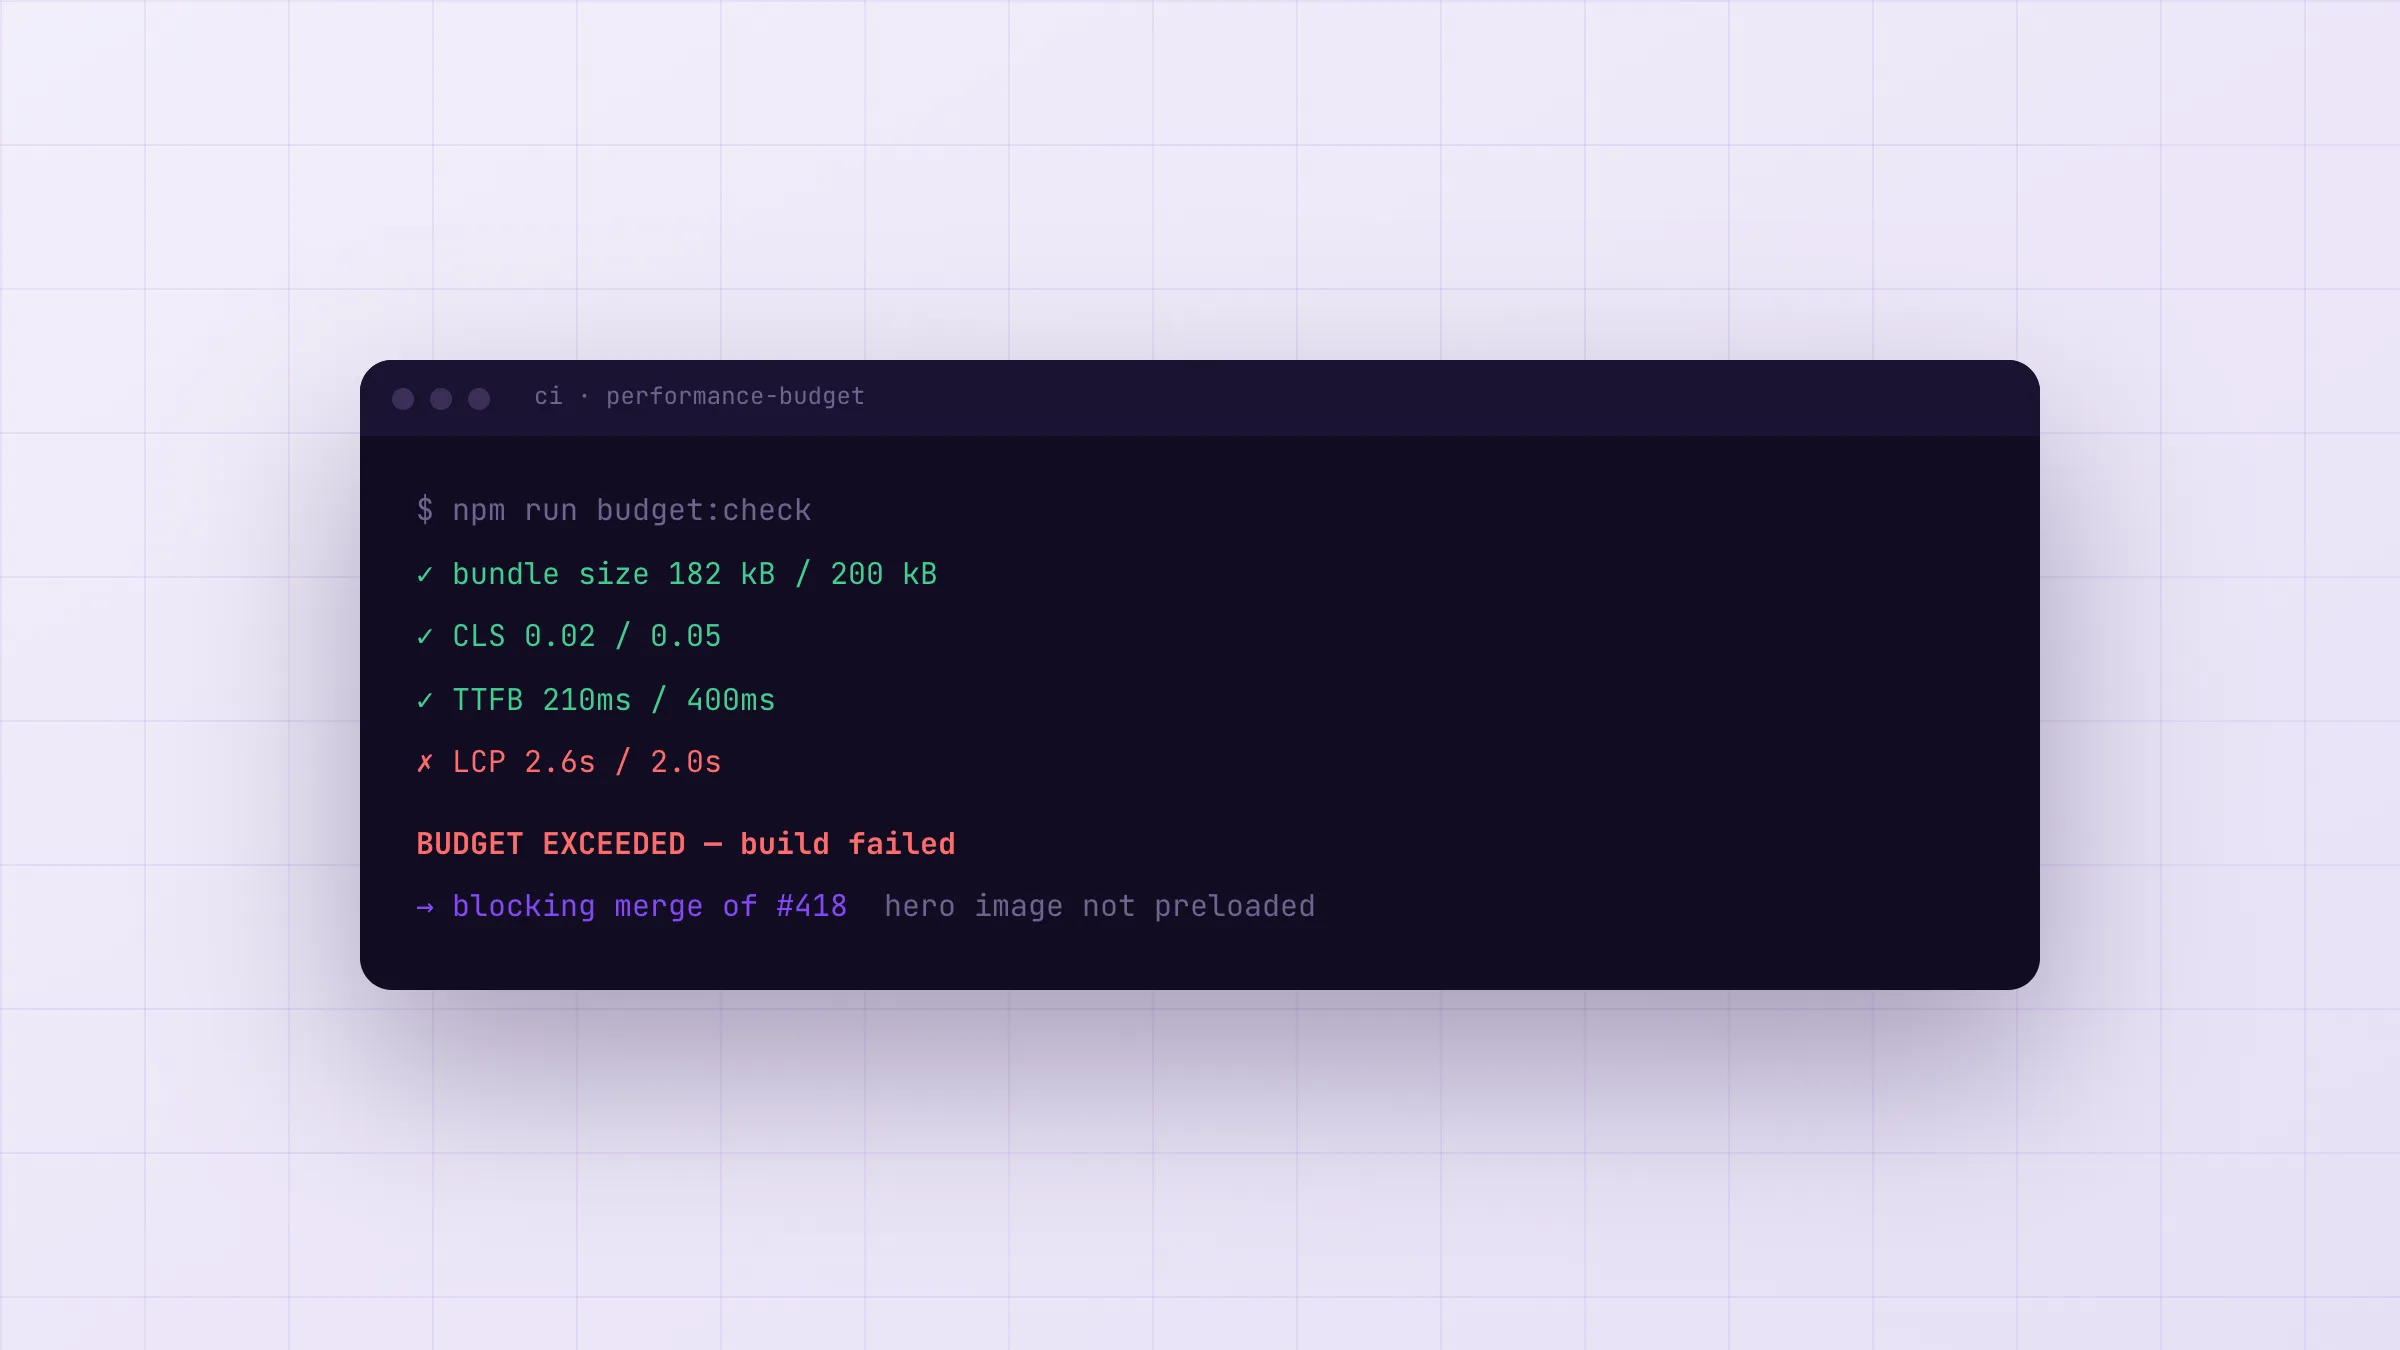
A Lighthouse score measures one run on one machine. A performance budget fails the build when a metric regresses. Set budgets on LCP, CLS and total JavaScript, enforce them in CI on every pull request, and the number stops drifting between launch and month six.
A Lighthouse score is a weighted average of five lab metrics captured in one run. A performance budget is a threshold that fails your build when a specific metric regresses. The score tells you roughly where you stand today; the budget is what stops you sliding backwards over the next six months.
Every project we take over from another agency arrives with a screenshot of a green Lighthouse score somewhere in the handover pack. It is usually eighteen months old, it was usually run on a laptop on office wifi, and it is usually the last time anybody measured anything.
#Why a score drifts and a budget does not
The score is an average. That is the whole problem. Five metrics, each weighted, collapsed into one number between 0 and 100. Largest Contentful Paint can get half a second worse while Total Blocking Time happens to improve, and the composite barely moves. Your customer does not experience a composite. They experience the half second.
A budget inverts the relationship. Instead of asking "what did we score", it asks "did any single number cross the line we agreed". If it did, the build does not merge. Nobody has to notice, nobody has to remember, and nobody has to volunteer to care about performance in a sprint where three other things are on fire.
#Which three numbers we hold every project to
We budget on three, and only three, because a budget nobody can recite is a budget nobody enforces.
LCP under 2.0 seconds on a throttled mid-tier mobile profile. Not 2.5 — the official "good" threshold — because 2.5 is where Google stops penalising you, not where a person stops feeling the wait. Building to the pass mark leaves you no headroom for the marketing team adding a hero video in month four.
CLS under 0.05. The official threshold is 0.1. In practice, anything above about 0.05 means an image, an ad slot or a late-loading font is moving content under someone\'s thumb. It is also the cheapest metric to fix and the easiest to regress, which makes it the best canary in the set.
A hard cap on shipped JavaScript, in kilobytes, agreed at kickoff. This is the one that actually changes behaviour, because it turns "should we add this library" from a taste argument into an arithmetic one.
#Where the check has to run
On the pull request. Not nightly, not weekly, not on a dashboard someone has bookmarked.
A nightly job produces a Slack message at 3am naming a commit from yesterday. By the time anyone reads it, three more commits have landed on top and nobody wants to be the person who reverts the sprint. A pull request check produces a red tick next to the change that caused it, while the person who wrote it still has the context loaded. The fix takes ten minutes instead of a planning cycle.
#What this costs
About two hours to set up and roughly ninety seconds per pull request. That is the entire price. The alternative — the one we keep being hired to fix — is a rebuild in year two because the site got slow so gradually that nobody could point at the commit that did it.
- A score is an average of five weighted metrics — it can stay green while the metric your users feel gets worse.
- Budget the metrics, not the score: LCP under 2.0s, CLS under 0.05, and a hard cap on shipped JavaScript.
- Run the check on every pull request, not nightly. A nightly job tells you who broke it; a PR check stops it landing.
- Test on a throttled mid-tier device profile. Your laptop is not your customer in a stairwell on 4G.